Push Network Case Study: GEO India and Indonesia with 72% ROI
Greetings to all interested in advertising through push networks and those just considering this source. In today’s case, I would like to share my personal experience of advertising Zeydoo affiliate network offers through the Push.House advertising network. This case study is not intended as an advertisement and is aimed solely at stating facts and sharing my experience. Whether to take all the statistics and analysis of the approach at face value or not is up to you. However, I hope my case will be helpful to you and vividly demonstrate the reality of profit.
So, without further ado – let’s get to it.
Traffic Source and Affiliate Network
Before diving into the details, let’s talk about choosing the traffic source and affiliate network. I used the Push.House push advertising network for advertising. I’ve been working with this platform for quite some time. The traffic is consistently of good quality and priced competitively in the market.
I chose an offer from the multi-vertical Zeydoo affiliate network. I’ve been working with this network for several years now, and throughout this time, there hasn’t been a single moment when they let me down or caused any uncertainties in payouts. Despite a wide selection of offers, my main favorites consist entirely of dating offers. In this case, it was also advertising of the Social Network Survey dating offer.
Case Overview:
- Offer: Social Network Survey
- Affiliate Network: Zeydoo
- Traffic Source: Push.House
- Advertising Format: OnClick
- GEO: India and Indonesia
- ROI: Indonesia – 72.28%; India – 31.32% and 32.41%
I chose India and Indonesia as the main GEOs for advertising. Previous experiences with Push.House have shown that traffic from Asian countries stands out particularly well compared to other GEOs in the advertising network.
Push.House recently introduced the OnClick format (also known as pop-ups), which, although it has not been officially announced yet, can be enabled individually. I found out about this upcoming feature from my personal manager. Since we have developed a friendly relationship, there was no need to persuade them for too long to enable the format for testing. As a result, the OnClick format appeared in my account within an hour.
Regarding preparing the advertising campaign for launch, the functionality here is standard, so let’s move straight to the settings.

In Push.House, you can use both in-house subscriber bases and your own collected ones, so I left the field with feed selection unchanged. The more traffic, the more profit.
I launched three advertising campaigns: two in India and one in Indonesia. Except for the GEOs, all settings were identical so that I will attach only one screenshot for India below. I set the click price according to Push.House recommendations.

At the time of the campaign launch, the recommended bid ranged from 0.0002 to 0.00025. I decided not to exceed it and stuck to the lower value. To save the budget, I added my own blacklist.
All three advertising campaigns were launched on mobile devices, mainly on the latest versions of the Android OS. I excluded older versions of Android (4-8). The offer advertiser only accepts traffic from Chrome, so I didn’t add other browsers.
Along with OnClick, a beta version of capping appeared in my account. To avoid unnecessary budget losses and not bother users with pop-ups more than necessary, I set the display frequency to once every 24 hours.

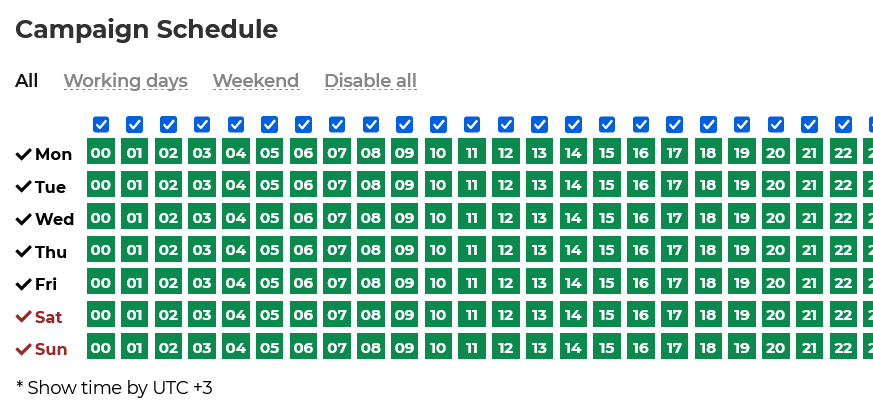
Based on my previous experience, I found that traffic converts equally well in India and Indonesia regardless of the time of day or week, so I didn’t adjust the display schedule.
Additionally, it’s important to mention automatic rules. Thanks to them, I saved part of the advertising budget and freed myself from manual control of sources.
Within this case, auto-rules were handy for controlling ROI, specifically: if the ROI from a specific placement was negative (-10%) within 24 hours, the source automatically is added to the blacklist.

For most Zeydoo offers, there are several options for landing pages. You can always run an A/B test and check its effectiveness if desired. In my case, stable results were achieved with the first choice.

As a result of the advertising, I achieved the following results. Below, I attach screenshots of statistics from Push.House and the tracker.
– GEO Indonesia (1 campaign)

– GEO India (2 campaigns)


– Push.House advertising account statistics

The most attentive may notice that the ROI metrics and the number of clicks on the screenshots differ. Anticipating possible comments, I remind you that the tracker accounts for approximately 15-20 % of traffic losses. The final ROI from the campaigns can be seen in the last screenshot:
- Indonesia – ≈ 72%
- India 1 – ≈ 31%
- India 2 – ≈ 32%
So, that concludes my case. I sincerely hope that it will be helpful to someone and will allow to replicate and exceed the results of this campaign. Finally, I would like to say that at the time of writing this case, the campaigns are still running and continue to deliver satisfactory results 🙂
Best of luck!